|
Aluminium Radiators &
Engineering Pty Ltd |
|
|||||||||||||||||||||||||||||||||||||||||||||||||||||||||||||||||||||||||||||||||||||||||||||||||||||||||||||||||||||||||||||||||||||||||||||||||||||||||||||||||||||||||||||||||||||||||||||
RESEARCH
& DEVELOPMENT
|
||||||||||||||||||||||||||||||||||||||||||||||||||||||||||||||||||||||||||||||||||||||||||||||||||||||||||||||||||||||||||||||||||||||||||||||||||||||||||||||||||||||||||||||||||||||||||||||

ARE Cooling dedicate substantial time and resources into developing, testing and refining our products in order to offer you the customer, a better product. Our products not only have a professional, good looking appearance but also perform to a high quality. We ensure this by utilising many R&D techniques, two of which are flow bench testing and flow meter testing. To see how the results of these tests have helped us refine our products please read Intercoolers - Must Read!
|
|
Charge Air Flow Bench Testing |
|
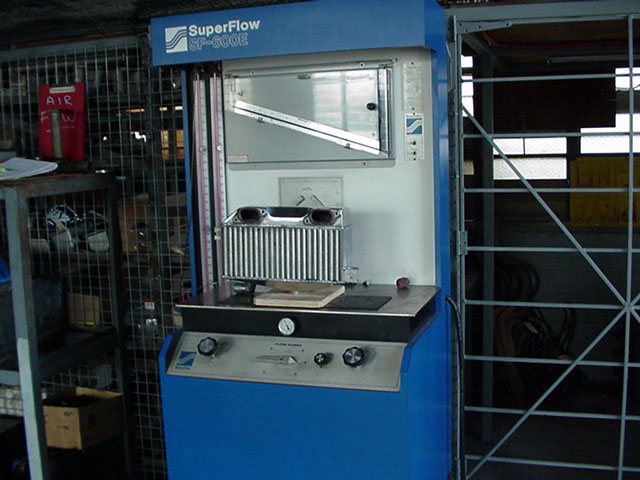
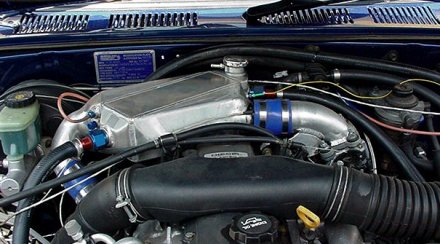
WRX upgrade top mount on the bench during development
This picture had to be taken from the side.
Development of our venturie plate option
|
BRYANT ENGINEERING (07-3277 6099) help me with most of our flow bench development work & are interested in the results. It is a Super Flow 600E test unit which has 8 motors allowing the high volume flow that I need for accuracy.
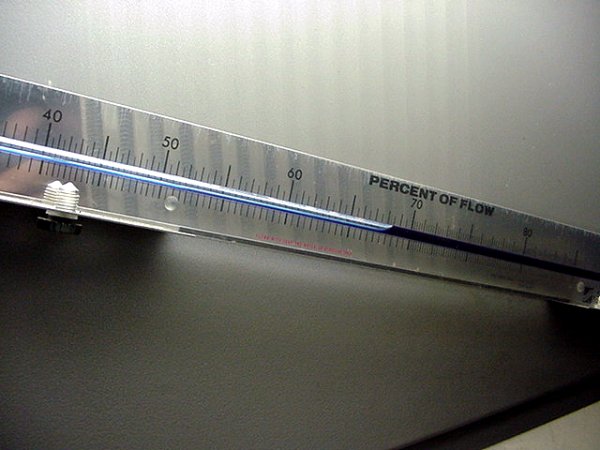
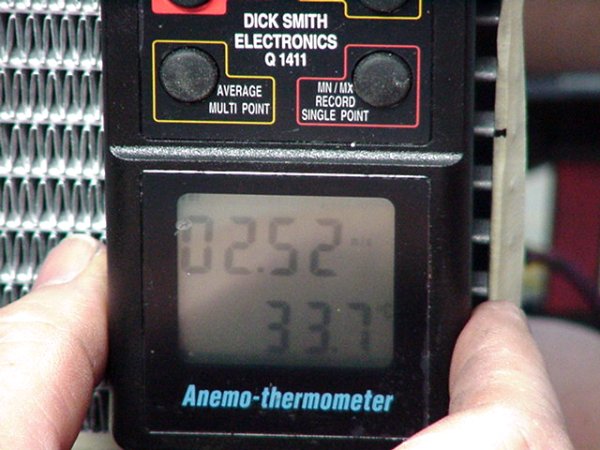
This is the manometer that gives us the reading to convert the air flow to cfm. The reading of 68.2 is the actual percentage of air passing through core & then the bench orifice compared to the un - restricted 100% that could be passing @ this setting. The reading then has to be converted using supplied calculus according to the number of the 8 motors in use, which of the 6 orifice sizes is selected, & the current barometric conditions. The result is a very accurate cubic feet per minute air flow figure - as long as the bench is Calibrated.
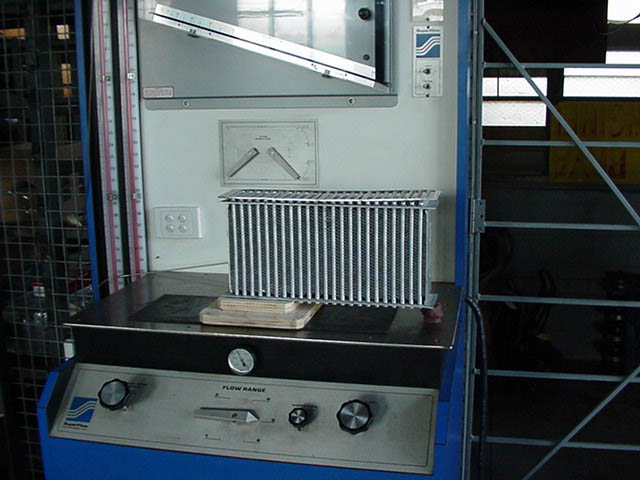
10/98 Testing a section of a tube/fin Intercooler core (Subaru WRX). Showing our "Venturie Plate" option we offer our customers. As plate position is critical this is as close as your going to see! (My time, my money). We even lost flow on the first day of testing. On this size core airflow increased from 762.2 cfm. to 798.4 cfm (@ 12" water). 4.5% may not sound much, but I would rather have it under my bonnet , than the guy's in the lane beside me! Remember that as boost increases,& so charge volume, the gain is exponential, making this option more worthwhile the more kw.. you are seeking. It is also more beneficial the smaller inlet window area / core area ratio you may have to use due to area constraints.
02/02 The results from this prototype air/water intercooler (after cooler in the industrial industry talk) are impressive & exceeded my expectations - like 97.8% effeciency !!! It is a combination of all my years of testing. |

Please note that in nearly all our fan tests we use a 4x4 as our power source as it has dual heavy duty batteries for a consistent test voltage. HOWEVER some tests are conducted with the engine running (approx 13.7v) & some with it off (12.4v), so do not COMPARE these differently sourced figures .
|
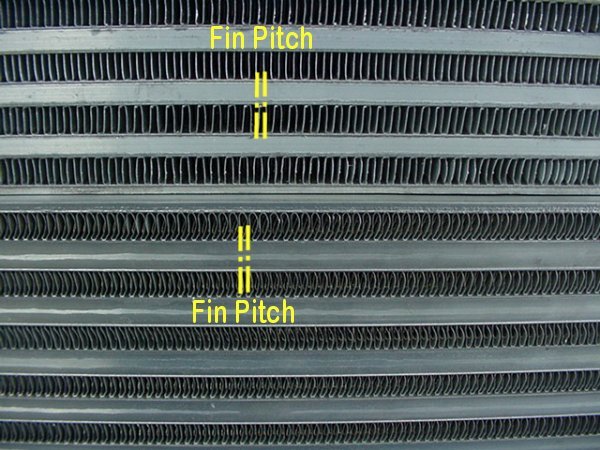
During the year 2000 we spent considerable time testing air flow (actually speed) through a variety of cores, both radiator, intercooler & oil cooler. The results were similar to what I expected from experience, although some of the differences were much larger than I imagined. This is not Rocket Science stuff & the instrument is not that expensive (in fact for it's price the repeatability of results is amazing, + or - 0.01%) but I'm not giving out the tables of results gained (even though some shop owners may not know what to do with them), the idea is for my shop to be able to supply the best product for YOUR application & to let you know that we take the most scientific & methodical approach possible to achieve this goal, - Not dazzle you with unsubstantiated verbal diarrhoea, Yeh,- plain old bullshit. Our first aim was the core thickness / fpi. ratio compared to air speed through the core. Each core was tested with 12" , 14" ' & 16" Davies Craig fans supplying the test air flow. The area of actual maximum flow off the fan blades was also surprising, being in more than I thought. Testing backed up that fin pitch is allot more restrictive to flow than core tickness. Since 2001, we have extended our testing to include oe. & also after market fans for a comparison of 'real world' performance. In mid 2002 & early '03 we spent allot of time comprehensively testing a range of after market fans, once again for what I consider 'real world' results. I have decided to upload some of our results as I believe they are too important too keep to ourselves as I'm positive it will help you better understand some of the problems you may be having, or make a better purchasing decision so you don't have these problems. If some of this information is used by another reseller, I'd like to think they'd give us some recognition, but, with all the testing we do, it gives us a more complete understanding of the results & overall cooling performance picture for our customers.
|
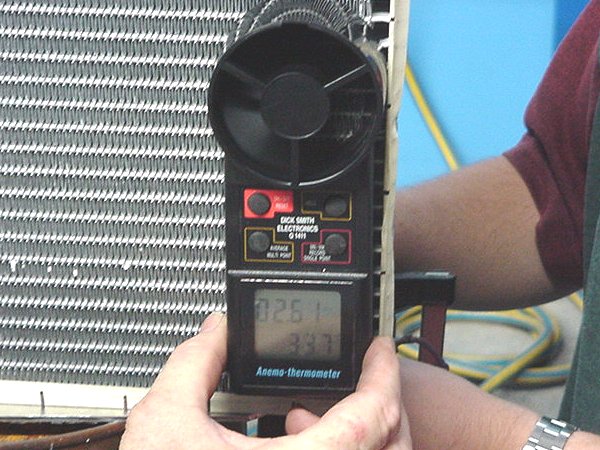
Reason for some of our testing Similar fin pitch but different shape gives different results.
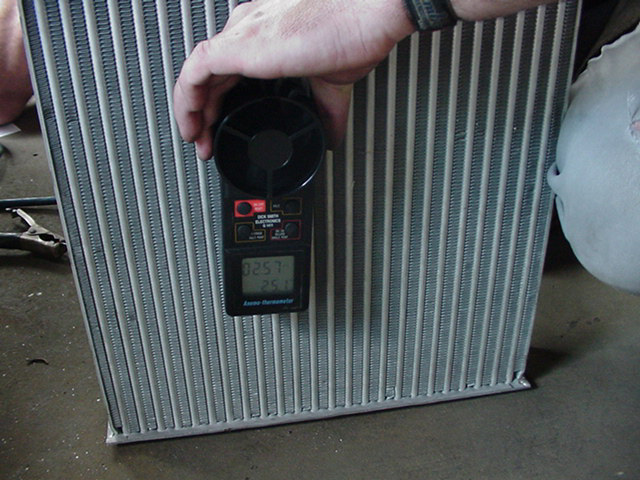
01/00. Testing air speed through an intercooler core.
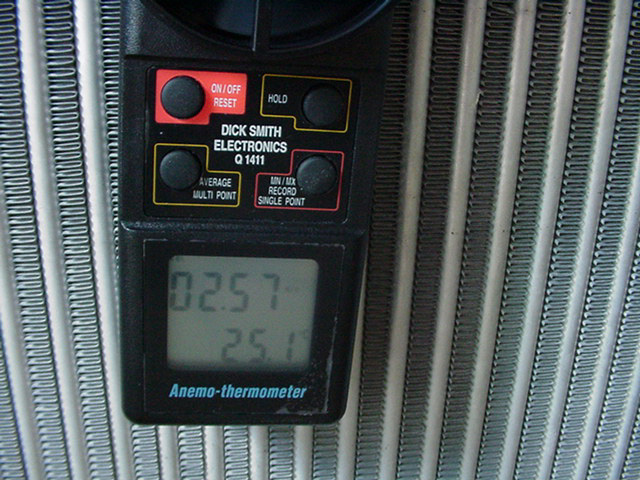
Close up of the readings obtained |
|
Test Results |
|||||||||||
| 08 / 01. We had concerns
over the pulling power of an oe. Austin Healey Midgets engine fan, so
the following tests were conducted. At this time, I did not have my weather station, so conditions are unknown. Test voltage was 14.33v
The following test was done with the blade left as supplied (PUSH) & the fan behind the core in a PULL position. The shape of the fan blade slicing through the air is convex instead of concave. As you can see, it is very important to check this.
|
|||||||||||
| 11/01 A
customer brought his FJ20 powered Datsun 1600 in for some work, one of
the jobs being overheating. He had fitted an oe. Nissan n12 Pulsar alloy/plastic assy. with an unknown thermo fan. We conducted the following tests @12.1v.
We fitted a DC 10" & 8" fans to give him 738cfm or an increase of 98% air flow.
|
|||||||||||
|
03 / 02 A customer had a 3 row
copper/brass radiator fitted to his VF Valiant to replace the oe. We did the following tests.
Note that the upgrade fan only pulled
17.4% (4.6m/s to 5.4m/s)extra air at the back of the blades but 116%
(2.6m/s to 1.2m/s) extra through the core ! |
|||||||||||
06 / 02 We tested Trevor Hydes
'66 Mustang. We fitted a 55mm @ 16fpi 2 row core & a shroud to suit his
flexalite metal blade engine fan as the car would just sit & idle away
just higher than the thermostat. I did not use the weather station
this day.
Note that the drop of flow through the core with a fan shroud is 22.1 % (4.75 m/s. to 3.56m/s) compared the the Valiant tested above without a fan shroud which is 73.9% (4.6m/s to 1.2m/s) with the oe. fan & 48% (5.4m/s to 2.6m/s) with the aftermarket fan. That's the advantage a fan shroud offers ! It also highlights the importance of placing the fan up against the core, or fully sealing a shroud properly as air is hard to pull through the core& will easily suck in through a small gap. |
||
|
03 / 03 Joe Mangano bought a 55mm @ 14fpi 2 row core off us for his '56 454 BB Chev. He was not happy, with two problems. After idling for 5 mins the temperature would start rising from 180c.& keep going up past 210c. Also when he switched the engine off, water would pour out the overflow. He determined he had cavitation & replaced the new cheaper aftermarket pump with an Eldbrock pump. This fixed the water out the overflow & it would now idle for 10 mins. before creeping up. This is not good enough for Joe, so we did some air flow tests through his core. Test voltage was not recorded. The results are:- Readings taken from front outside of the core in to the centre. Note that the shroud is not centred to the radiator.
Note that 1.99m/s (meters/second) = only 7.74 kilometers/hour (kph), so the engine fan he has fitted is far too weak. He has two other fans to try & he will need between 50% to 100% more air flow through the core to have a safe margin for any conditions.
|
| Fan (Thermo & engine) Air Flow Testing |
Please note that in nearly all our fan tests we use a 4x4 as our power source as it has dual heavy duty batteries for a consistent test voltage. HOWEVER some tests are conducted with the engine running (approx 13.7v) & some with it off (approx. 12.4v), so do not COMPARE these differently sourced figures !
Also, these figures are achieved in our workshop, with our equipment, by us, as accurately as possible without favour to any manufacturer, for our own use.
|
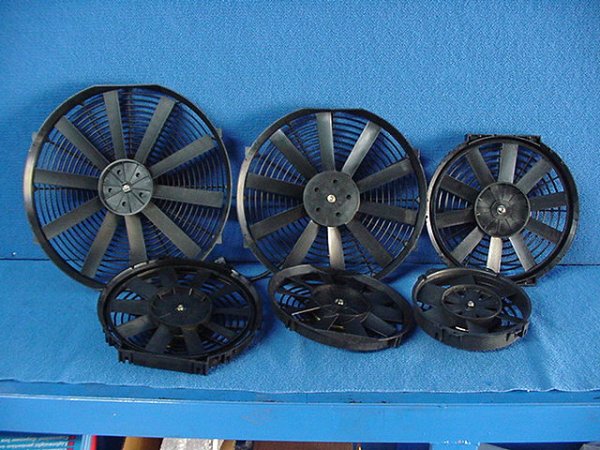
6 fans tested in late '02
The air speed meter we use. Note the reference marks on the core so all readings are consistent.
This stays in it's boxed packing & is treated very carefully |
This is a PDF file 4.4 kb.
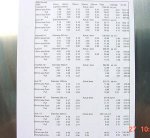
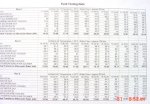
Results of 8 fans tested in a real world environment.
|
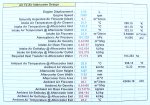
01/03 This is a copy of our spreadsheet of our own fan tests. Once again my disclaimer is that they were tested to our parameters, with our equipment for our knowledge & are totally independent. NOTE that the cfm. figures are for air flow through the fan as we only measured inside the fan shroud case at the front of the core. If you want to compare them for actual cooling ability with the results from a car with a fan built into a shroud that encloses the whole core, you have too factor in the different surface areas. They are 4 of the same Australian brand fan & 4 from an importer of fans, which must be noted that 2 were Chinese, 1 American & 1 un- branded, although they all had the same proprietary brand - (buyer beware). These cannot be directly compared with some of our other tests, as the conditions differ. The most important aspect of consistency is the position of the meter in relation to the fan blade, as you can see in the charts, the distance in from the end of the blade gives very different flow rates. We mark the core with a grid pattern of a set size so the readings are repeatable. The next most important aspect to consistent results is the supply voltage, crank up the alternator output & the fan will pull noticeably more cfm. Atmospheric conditions play a small part in the readings, so lately we have been recording them with a very accurate weather station, so we are as consistent as possible. NOTE : the results of the test performed with the fan blade on the correct way - 1362 cfm & then incorrect - 883 cfm - a loss of 65% flow !! A thermo fan comes as either a 'pusher' (usually) or 'puller' & if used in the opposite application, has to have the fan blade reversed. During our tests we broke one of the import fans because the blade was not removable, this was only on their 12" model. These results can also be related too intercooler core thickness, or lots of products for that matter, even grille mesh. The thicker the core, the less air will pass through.
|
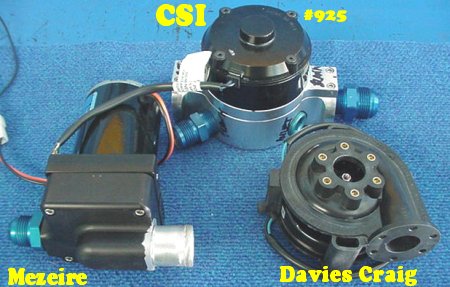
| Electric Water Pump flow Tests. |
December 2003
Please note that all these pump tests used our Skyline GTSt as the power source as it has a new larger Delco battery for a consistent test voltage. HOWEVER some tests are conducted with the engine running (approx 14.2v) & some with it off (approx. 12.5v), so please take note of the voltage source when comparing !
Also, these figures are achieved in our workshop, with our equipment, by us, as accurately as possible without favour to any manufacturer, for our own use.
| PUMP | Current | Draw | 5 cm head | 131cm head | 241cm head |
| CSI no. 925 | 12.51volt | 58.45 litres/min. | |||
| with 1 outlet | 14.25 volt | 7.85 amps | 68.84 litres/min. | 52.72 litres/min. | 28.96 litres/min. |
| with 2 outlets | 14.27 volt | 80.39 litres/min. | |||
| Mezeire-black | 12.52 volt | 59.86 litres/min. | |||
| 14.26 volt | 7.22 amps | 68.53 litres/min. | 45.83 litres/min. | 39.53 litres/min. | |
| Davies Craig | 12.51 volt | 80.48 litres/min | |||
| EWP. | 14.24 volt | 5.38 amps | 88.69 litres/min. | 73.54 Litres/min. | 43.89 Litres/min. |
| Hose- free flow | negative 32 | cm. head | 50.32 litres/sec | Note this pump inlet | hose is 38mm ID. |
The csi pump was initially tested with one outlet plugged as in a conventional setup, then with both outlets open as in a V8 configuration. We did not bother to set up a dual head height setup, as it was still less than the D.C. pump & is near twice the price !
 |
 |
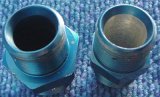 |
| Testing the 'head' flow of the pumps. Gives a more useful performance rating than open flow. 2.41 meters shown. | The three pumps tested above. Note the enlarged inlet pipe on Mezeire, largest fittings on CSI, std. DC. | Bored out fittings used to test CSI pump |
|
Our 'Sizing' Spreadsheets |
||
These are PDF files
This is our spreadsheet for air/air calculus. 29 lines of data
This is our spreadsheet for air/water calculus. 61 lines of data. & 10 times harder to set up properly !!
|
Danny Irvine is a talented engineer who has (sometimes immeasurably) helped me with 'starting in the ball park' with many of our projects. He has given me the calculations & ideas that has sometimes short circuited heaps of wasted experimentation effort. These spreadsheets were developed by Danny for ARE & are proving an invaluable tool in providing us with a spreadsheet to be able to properly size an intercooler &/or radiator for any given application. We are still having to fine tune some of the formula (not conversion rates) as we build our own Data Base, but this is decreasing & becoming more accurate nearly everytime we plug a new set of figures in. It would not be possible without the expense of purchasing our test equipment, but to me it is well worth it as I know the product we sell is the best possible. We are getting a very clear picture of what to expect, & this is now visibly, accurately & unquestionably backed up by the Data Log results we are accumulating from street, track & dyno testing. Please note that some lines have been left out of both spreadsheets. We want to keep some of the data & calculus totally in house ! but we also want to let you see that we try extremely hard to have the best knowledge possible of what we sell. |
|

|
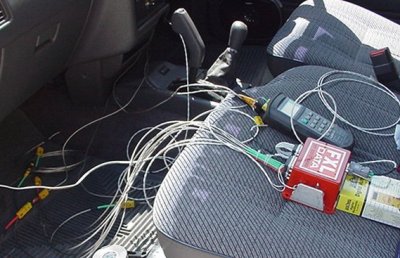
Over the years a few of our products have not performed as they should ( mostly radiators) & many results of testing & prototypes have not given the answers expected, with some of these results being impossible to find a logical answer too. When dyno testing & in particular road testing, it is impossible to write down all the figures at a particular second of the test, so the results can be a little distorted, or worse, be recorded wrong. To assure our testing is as comprehensive, accurate, repeatable & easy to understand as possible, we have purchased a twelve channel (eight, seven or six for temperature, depending on whether none, one or two boost channels are used) FXL data logger off Graham ph. no. (07) who has been manufacturing these drag racing based loggers for 5 years. It is a matter of connecting the probes to the engine, running the leads out under the bonnet, in through the passenger window, going for a run on the dyno or road, recording the 15 seconds of information, downloading it onto the laptop, & I'm ready for another test, or back to work to analyse the results. I can leave them as line graph, or print them out on a spreadsheet, & have them for future reference or comparison. Apart from the obvious intercooler efficiencies, we will be testing the relationship of engine output to radiator water temps at different positions. The only radiators that have not performed up to our standards have been three 57mm thick, large crossflow units, so I'm going to put all eight probes into one of these & see if my theory is right or not. It is also real graphic as too the operation of the intercooler - monstrous differences between out of the turbo compared to out of the intercooler. A real interesting area of testing that will open allot of peoples eyes will be under bonnet temperature testing & also the heat soak that can be picked up in pipework. I have seen over 80 deg. c. on a street car. With all eight probes in use I will be able to determine the "hot spots" in a cars engine bay.
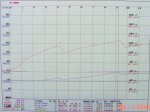
Notes 1) This is a part of our own log & it is the first of many I have seen so many "claimed" figures for intercooler performances that not only are the people/occasional company & especially the magazines that print them - are plain dickheads. I have seen in car pictures of a hand held thermometer reading 4 - 10 deg. c. held beside a speedo reading 80 -110 kph. Sorry, but that means Jackshit. What was the ambient temp., was it under full throttle or coasting down? Intake temp. figures can make dyno figures look split atom accurate. Off the soap box.Water temps at different points in the cooling system are just as important to me, so it makes our investment worthwhile. Too read our graphs ( I apologise for the blurred PDF) its easiest to note the position of the red curser line & the temp. no.1 to 8 figures underneath right are at that particular 1/50 th of a second. I will try too keep the same configuration all the time. In this file 146.8
Note how both the charge air temps drop with the gear change & especially how quick. The charge out of the intercooler only varies just less than 50% than the pre 'cooler air. This was an air water intercooler on our Skyline GTST running at 75% water pump speed, so it's telling me it needs full pump speed & a slightly larger intercooler. xxxxxxxxxxxxxxxxxxxxxxxxxxxxxxxxxxxxxxxxxxxxxxxxxxxxxxxx Notes A) This is a prototype air/water intercooler we fabricated for Atlas Engineering's Forest mulching machine. It is powered by a Cummins Straight 6 cyl. turbo diesel, rated @ kw. We had never made anything like this application before, but with some guidance from Danny Irvine, our spreadsheets, air flow bench testing, experience, couple of guesses, fabricated a unit that we knew would meet the Cummins criteria. I wasn't prepared for just how much we exceeded it. As you can see by the results, our intercooler is extremely efficient, but the final result is let down by pour performing radiators - which we had no say in their selection. Have a look at the results of test 5 @ 14:45:40 (recorded in actual time) @ a flow rate of 126 l/m Radiator in - combined water from the i/c. into radiator ...........................................68.1 deg. c. Radiator out - water temperature out of radiator, so it could only remove 3.1 deg!!...65. deg. c. R H. water out - temp. of the water out of the right side of i/c. .................................74. deg. c. Charge air (post cooler) - air temperature out of intercooler .....................................64.7 deg. c. L H. water out - water temp. out of the left side of the i/c. .......................................64.7 deg. c. L H water in - water temp. going into i/c. note lost 0.6 deg in hose from rad. ............64.5 deg. c. Charge air (pre cooler) - air temp. out of turbo .......................................................172.9 deg. c. Heat transfer to aftercooler water (KW) - the actual kilowatts of heat removed ........77.8 kw. The intercooler to water efficiency is 99.8% !!! The intercooler to ambient efficiency is 70.8%. The radiator efficiency is 6.9% (good eh!). As you can see, our intercooler removed 108.7 degrees (167%) from the charge air, but the radiator could only remove 3.1 deg. c.(5%). It was approx 750 x 750 x 75mm & had a 650mm variable speed & pitch fan, so don't underestimate the size & type of radiator needed. Our innovative design allows for one water outlet temp. to be 74 deg., one 64.7 deg. & the charge air 64.7 deg. (at this particular second). Imagine if this water was run through an 'ice box' ! Unfortunately Cummins specifications are inlet air temp. must be no higher than 30 deg. above ambient. The company is flying a radiator out from Italy to try & compliment our intercooler. In test no.6 @ 15:04:40 @ a water flow rate of 55 l/m. the results are a little different. Radiator in - combined water from the i/c. into radiator ..............................................65.1 deg. c. Radiator out - water temperature out of radiator, it removed 12.4 deg!!....................52.7 deg. c. R H. water out - temp. of the water out of the right side of i/c. .................................106.3 deg. c. Charge air (post cooler) - air temperature out of intercooler .......................................56.9 deg. c. L H. water out - water temp. out of the left side of the i/c. ...........................................60.1 deg. c. L H water in - water temp. going into i/c. note lost 0.6 deg in hose from rad. ................53. deg. c. Charge air (pre cooler) - air temp. out of turbo ...........................................................157.3 deg. c. Heat transfer to aftercooler water (KW) - the actual kilowatts of heat removed .............72.2 kw. The intercooler to water efficiency is 96.3% ! The intercooler to ambient efficiency is 73.1%. The radiator efficiency is 27.5%. The radiator could pull 12.4 deg. (23%) out of the water& the i/c. could pull 100.4 deg.c (176%) with the water going in. Note the temp of the water out of the RH. side - 106 deg., a rise of 32 deg with a lower charge air temp. If our i/c. was undersize, it's efficiency would've really suffered at this low flow rate. Notes B) A whole bunch of figures are educational, but to me they don't have the impact of a graph. I often convert the data to graphs as it gives me a better understanding, quicker, & stays with me longer. Our data logger gives both on the one page - best of both worlds. For example, these snapshots are of a machine that operates nearly all the time at a constant throttle setting, with the load varying due to size of trees, but look how much the temp. out of the turbo varies. Note that at 14:55:00, the throttle was backed off. Also note that the above data is from a hired mega dollar unit, our data logger has a couple more channels but only records for 15 secs., not 30 mins like this unit.
|
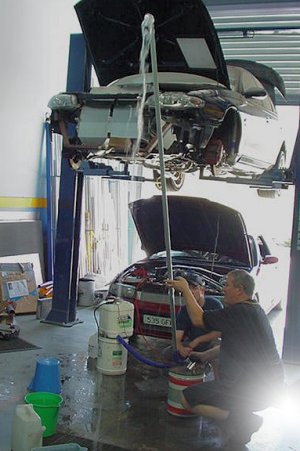
The datalogger unit set up in the car ready for a test run.
Data logger leads connected to the engine components.
These are PDF files of Data Logs tests.
Snapshot of our own data log. See notes 1)
xxxxxxxxxxxxx
Field test spreadsheet of a large Industrial air/ water intercooler. 7 kb file. See notes A ) on left
Line graph taken from above. 11 kb.file. See notes B) on left
|
||||||||||||||||||||||||||||||||

© Aluminium Radiators and Engineering
Pty Ltd (ARE Cooling)
While every effort is made to ensure details and information is correct at
time of publishing
Sunday, 05 August 2012
please contact ARE by phone, fax or email to confirm prices before
order.